| Home > Excel Business Solutions > Excel Productivity > Training and Tutorials > Stock Trading System | Share |
Stock Trading System
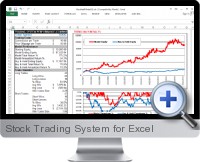
Excel stock trading system for training and tutorials
Excel Stock Trading System | Rate this solution: (4/5 from 5 votes) |
|
The Stock Trading System for Excel is a step-by-step course on how to build a sophisticated automated stock trading model using Microsoft Excel. Microsoft's Visual Basic (VBA) language is used in conjunction with Excel's user interface, formulas, and calculation capabilities to deliver a powerful and flexible trading tool. The Stock Trading System for Excel includes five proven technical indicators (ADX, moving average crossovers, stochastics, Bollinger bands, and DMI). You are guided in a detailed fashion through creating worksheets, files, ranges, indicator formulas, control buttons, DDE/Active-X links, and code modules. After building the Stock Trading System for Excel, you simply import the data you need, run the model automatically with a click of a button, and make your trading decisions. The Stock Trading System for Excel incorporates both trend-trading and swing-trading features. The swing-trading feature can be turned on or off, depending upon your investing style. The system operates with your choice of free ASCII text files available on the internet, or a subscription data service (with our without a DDE link). The Stock Trading System for Excel can be used alone or in conjunction with your existing fundamental and market analysis to improve investment timing and avoid unprofitable situations. A complete PDF Guide is provided along with a step-by-step Online Course so you can choose how to learn in the most comfortable way. A separate pre-built Back testing Model is also included for historical analysis and testing various stocks and time periods. Key Features on the Stock Trading System for Excel course include:
Stock Trading System for Excel Table of Contents:
| |
Related Excel Solutions for Stock Trading SystemTrading Data AnalysisTechnical Analysis Complete Trading SystemTechnical Analysis Spread Trading SystemTraining and Tutorials |
| Share your thoughts and opinion with other users: Create Review |
Browse Main Excel Solution CategoriesBusiness Finance Financial Markets Operations Management Excel Productivity |
Additional Excel business solutions are categorized as Free Excel solutions and the most popular. Further solutions proposed for specific user requirements can be either found in the Excel Help Forum.