Data Segmentation Charts
Excel data segmentation charts for presentation and reporting
Excel Data Segmentation Charts | Rate this solution: (3.6/5 from 8 votes) |
Data segmentation charts (PlusX) is a free Excel add-in that provides chart visualization tools for analysis of data segments and itemization. Charting tools are designed to analyze multiple dimensions of data for processes and project management to enhance dashboard and standard reporting. Additional utilities provided enhance web connectivity with Excel including live FX rates as well as useful formatting commands.
Key features of the data segmentation charts include:
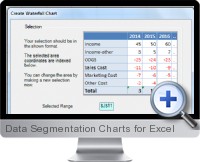
- Waterfall Chart tool visualizes the segments of totals in a cascading view. The waterfall chart can be customized for showing differences between periods and unlimited segments with one or more columns of data.
- Project Gantt chart tool displays the segments of a project time line broken into tasks over time periods. The input data can be by date or by start date with a day count for each task.
- Double Donut chart tool allows to segment data at two levels to visualize the first breakdown in the outer ring and then the breakdown of those segments in the inner ring.
- QIGS chart tool shows the Quality Increase of Goods sold by segmentation of earnings differences between two strategies. With quantity and earnings data for two different strategies by product or entity, the visualization shows the difference by profitability, QIGS product mix and sold amount.
- Mirror chart tool visualizes data on a scale that segments negative and positive deviations from a central axis which is useful for comparing two categories within a data set.
- Bubble chart tool provides an easy solution for displaying 3 dimensions for each segment or category within the data. The bubble chart automatically adds labels and axis titles to get around limitations of the native Excel bubble charting functionality.
- Additional tools enable the ability to apply numerical, textual and conditional formatting quickly to ranges of data in order to speed up development time for creating dashboard reports. Live FX rates can be integrated into analysis and a custom web browser within Excel facilitates the importing of web based information into Excel reporting.
Try It FREE(Updated on 2024-02-01) |
Additional Excel business solutions are categorized as
Free Excel solutions and the
most popular. Further solutions proposed for specific user requirements can be either found in the
Excel Help Forum.