Home > Excel Business Solutions > Operations and Management > Manufacturing and Engineering > Sankey Diagrams Share

Sankey Diagrams

Excel sankey diagrams for manufacturing and engineering


Excel Sankey Diagrams

Rate this solution:
(3.7/5 from 9 votes)
Sankey Diagrams screenshot
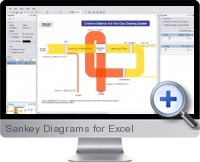
Sankey Diagrams for Excel (e!Sankey) is an application to create compelling Sankey diagrams and flow charts with the option to import data from Excel spreadsheets. Sankey diagrams display material, energy and cost flows of process systems through flow presentations in which the width of the arrows is shown proportionally to the flow quantity.

Key features of Sankey Diagrams for Excel include:

  • Easy to use with floating, dockable, hideable and tabbed windows.
  • Multiple document handling on tabbed pages.
  • Ability to copy to clipboard and copy between diagrams.
  • Undo and redo capability.
  • Overview window with zoomed out overview and moveable visible area
  • Unicode character support for diagrams with Japanese, Chinese, Arabic etc.
  • Start center with thumbnail gallery preview.
  • Create and load templates.
  • Sample diagrams library for quick starting points.
  • Interface also available in German, French, Spanish and Portuguese.
  • Print Sankey diagrams or export as BMP, JPG, GIF, PNG, and EMF formats for reporting and presentation.
  • Update diagram flow values from Excel spreadsheet cells.
  • Exported diagram files can be opened by other applications (e.g. Umberto).
  • Apply processes, nodes, transitions and arrows.
  • Utilize graphical elements: rectangle, rounded rectangle, ellipse, line and more.
  • Cut, copy and paste diagram structures.
  • Add and edit text labels with rotation capability.
  • Insert images.
  • Line tool with alternative line terminators.
  • Editor options include grid, snap to grid and zoom.
  • Drag and resize process symbols.
  • Option to hide processes.
  • Visualize stocks at processes with stubs and display in/out stocks or stock difference.
  • Use images or clip art as process symbols.
  • Set arrow connectivity as free, left-to-right or top-to-bottom.
  • Connect lines and arrows by clicking on a process and directly connecting it to another process.
  • Add one or more entries to arrow as flows, enter the quantity and choose a color.
  • Transparency options for crossing arrows.
  • Stack arrows and change the stacking order.
  • Arrow options include rounded, orthogonal bends, arrow head and arrow tail.
  • Use joint arrow heads, arrow spikes and specify arrow head/tail angle, curve amount, border and color.
  • Automatic arrow label with flow name, quantity, unit, and arrow comment.
  • Select individual color pallets for each unit type.
  • Create custom color pallets, favorites list with more than 40 patterns
  • Apply line styles, background colors, color settings for all editor elements, color transparency and linear gradients.

Try It  Get It

(Pricing is available on the next page)
(Updated on 2024-01-01)

Related Excel Solutions for Sankey Diagrams

Advanced ChartsTechnical Analysis  Treemap Add-inPresentation and Reporting  Six Sigma TemplatesProcess Management  Energy ConversionManufacturing and Engineering  Physical Properties and Steam ApproximationManufacturing and Engineering  QFD, FMEA and Pugh TemplatesManufacturing and Engineering

Latest Reviews for Excel Sankey Diagrams:

Share your opinion with others: Create Review
Reviewed by Einhorst on
Best tool for drawing Sankey charts and link the values to excel. Way better than handling that through Excel itself or other tools.

Reviewed by Jason mill on
Complex but very powerful tool. Linking flow values to Excel has worked out perfectly


Browse Main Excel Solution Categories

Business Finance Financial Markets Operations Management Excel Productivity

Additional Excel business solutions are categorized as and the . Further solutions proposed for specific user requirements can be either found in the Excel Help Forum.