Waterfall Chart Generator
Excel waterfall chart generator for presentation and reporting
Excel Waterfall Chart Generator | Rate this solution: (3/5 from 2 votes) |
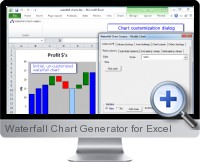
The Excel Waterfall Chart Generator provides a menu option in excel to generate waterfall charts from data with Excel. Waterfall charts can be quickly generated with a variety of options for style and display for reporting purposes.
Key features of the Excel Waterfall Chart Generator include:
- The Excel add-in supplies and easy to use menu item in Excel.
- Help material and example files allow fast training and advice for data visualization through waterfall charting.
- Specify colors to apply to increasing, declining, base and end values in the chart.
- Apply solid or gradient fills to the waterfall charting.
- The Excel waterfall chart generator add-in is compatible with all 32 and 64 bit versions of Excel.
Try It Get It (Pricing is available on the next page)(Updated on 2024-08-01) |
Additional Excel business solutions are categorized as
Free Excel solutions and the
most popular. Further solutions proposed for specific user requirements can be either found in the
Excel Help Forum.
